 |
Ideas in Hospital-Based Imaging |
Economic Impact of an Extravasation: An Analysis
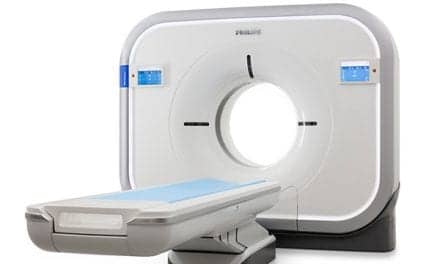
TJU Puts 64-Slice CT in ED
More than Meets the Eye
Market for Temporary Technologists Continues to Thrive
Economic Impact of an Extravasation: An Analysis
By Timothy Paice
 |
An extravasation of contrast medium during a CT scan is a well-recognized complication.1 Certain aspects of an extravasation are easily understood and recognizable—the impact to the patient and technologist, the scanner schedule, and the potential need for surgical intervention. One aspect that might not be readily apparent is the potential for a medical professional liability claim, which could be due in part to the difficulty of obtaining empirical data.
Still, the frequency with which a technologist would see an extravasation is fairly low. In fact, the reported extravasation rate during CT scans ranges from 0.14% to 0.9%, with an average of 0.43% of CT scans resulting in an extravasation.2–7 Based on this data, a technologist operating an average scanner would likely view an extravasation once in 233 CT scans.
Certain risk factors contribute to the likelihood of an extravasation, including patient factors, contrast media type and volume, and injection technique.1 Patient factors include those patients who cannot communicate adequately (eg, elderly, infants, or patients with altered consciousness), ill or debilitated patients, and patients with abnormal circulation.8 The contrast type and volume also can affect the likelihood and severity of an extravasation. Generally, a patient can tolerate a low-osmolar contrast medium better than high-osmolar; however, a patient might be able to sense an extravasation better with a high-osmolar contrast medium due to increased reaction with high-osmolar.1 Additionally, large-volume extravasations could lead to a more severe extravasation injury.1 The injection technique also can contribute to the likelihood of an extravasation; such factors include the use of a metal needle instead of a plastic cannula, the site of an injection, and the use of mechanical power injection.1
In order to lessen an extravasation’s severity, it is important to take preventive measures and provide proper treatment if an extravasation occurs. A critical step of preventing an extravasation is direct monitoring of the injection site by palpation.8 After an extravasation occurs, certain conservative measures can be taken to potentially resolve extravasation injuries, including the recommended elevation of the affected extremity, the application of a warm or cold compress, and a possible surgical consultation for those patients with high-volume extravasations or increasing symptoms.8
 |
| Figure 1. Severe settlement distribution. |
Classification and Likelihood of Categorized Extravasation
Two schools of thought exist for classifying an extravasation: The first is basing it on the volume of extravasated contrast media; the second is basing it on the resulting injuries of an extravasation. Generally, the first is categorized into three groups: minor (less than 10 mL), moderate (10–49 mL), or major (50 mL or more).4 The second is categorized into three groups as well: mild, moderate, or severe.3
In order to correlate the empirical data, it is important to determine the appropriate classification system. When examining the settlement and verdict findings, it is readily apparent that the description of resulting payment describes the nature of the injury and not the volume of extravasated contrast media. For this reason, extravasations should be categorized by the nature of the resulting injury. A mild reaction is if the patient had minimal signs or symptoms with resolution by conservative treatment within 1 to 2 days.3 A moderate reaction is if the patient experienced partial skin loss, as evidenced by blistering or ulceration, or other signs and symptoms that persisted longer than 2 days.3 A severe reaction is if the patient experienced a reaction that required surgical treatment, such as fasciotomy, debridement, or reconstruction.3
Before examining the likelihood of each categorized extravasation, it would be worthwhile to consider the annual number of contrast-enhanced CT scans. In 2004, 50.1 million CT scans were performed in 7,355 US hospital and nonhospital facilities.9 Of the 50.1 million, 29.3 million (58%) used an injectable contrast media.9 Based on the number of facilities, the average number of CT scans using injectable contrast media in 2004 was 3,984 (10.9 per day). And of the 29.3 million CT scans using injectable contrast, 26.1 million (89%) used power injectors during the CT scan.9 Additionally, the number of CT power injectors in 2004 was 8,710, which results in an average number of contrast-enhanced power-injected CT scans of 2,994 (8.2 per day) per injector.9
As previously discussed, an average extravasation occurs in 1 out of 233 CT scans (0.43%). Of these extravasations, it is important to determine what percentage would be mild, moderate, or severe. Based on previous research findings, mild extravasations account for the majority (90.1%) of all extravasations, and moderate and severe account for 7.8% and 2.1%, respectively.2–3 Taking the aggregate average of extravasations and correlating that with the categorized severity percentages, it is determined that a mild extravasation occurs once in 258 CT scans, a moderate extravasation occurs once in 2,982 CT scans, and a severe extravasation occurs once in 11,074 CT scans.
To understand what a facility’s vulnerability to extravasations might look like, examine the mentioned frequency and relate this to the aforementioned average annual contrast-enhanced CT scans data. First, on a per-facility level, the average number of CT scans using injectable contrast media was 3,984, which would imply that an average facility experiences a mild extravasation every 24 business days (once a month*), moderate extravasation every 273 business days (once in 11 months*), and severe extravasation every 1,014 business days (once in 3.4 years*). Second, on the per-injector level, the average number of power-injected CT scans was 2,994, which implies that an average power injector experiences a mild extravasation every 31 business days (once in 1.3 months*), moderate extravasation every 364 business days (once in 1.2 years*), and severe extravasation every 1,350 business days (once in 4.5 years*).
 |
| Shown here are an MR image of a saline extravasation in the arm (above left) and an MR image of a saline extravasation in antecubital space (above right). |
Empirical Settlement and Verdict Data
A search of several legal and government databases revealed that previous extravasation settlements and jury verdicts ranged from $750 to $1.5 million.10–22 These particular settlements dated from 1983 to 2004; in order to digest the settlement and verdict data, these findings were adjusted to represent their present value. As a result, the adjusted range of empirical settlement and verdict data is $1,045 to $2.9 million.
But which settlements and verdicts resulted from mild, moderate, or severe extravasations? Based on the empirical data, none were a result of a mild extravasation. Moderate extravasations accounted for a minority of settlements and verdicts, with an indemnity or award payment ranging from $1,045 to $74,421. The majority of the empirical data was a result of a severe extravasation, which ranged from $3,294 to $2.9 million.
The next step is to examine both the moderate and severe extravasation empirical data ranges, and determine what the average potential liability for a moderate or severe extravasation might look like. First, the moderate range was analyzed with the desire of removing the abnormal or outlier cases. In order to remove such cases and thereby illustrate a normal moderate indemnity or award, the probability range was determined. The probability range in the instance of examining settlements and verdicts included those cases between the 25th and 75th percentile (50%) of moderate settlements and verdicts. The probability range for a moderate extravasation was $4,526 to $27,569, with an average potential liability cost of $14,118. The probability range for a severe extravasation was $32,282 to $171,996, with an average potential liability cost of $94,056 (see Figure 1).
Final Thoughts
As previously discussed, a hospital or nonhospital facility should be concerned with several aspects of an extravasation. Medical professional liability is one of the least understood facets. Even a small-percentage problem can be a considerable financial liability. To minimize liability, every effort should be made to prevent and mitigate any extravasation that a facility might see, and it should be handled with diligence by the technologists, radiologists, and staff alike.
*Assuming 25 business days per month and 300 business days per year.
Timothy Paice is a recent graduate of the University of Pittsburgh’s JD/MBA joint-degree program. He currently is preparing for the Bar examination in North Carolina. For more information, contact .
References
- Bellin MF, Jakobsen JA, Tomassin I, et al. Contrast medium extravasation injury: guidelines for prevention and management. Eur Radiol. 2002;12(11):2807–2812.
- Cohan RH, Ellis JH, Garner WL. Extravasation of radiographic contrast material: recognition, prevention, and treatment. Radiology. 1996;200:593–604. Available at: http://radiology.rsnajnls.org/cgi/reprint/200/3/593.pdf. Accessed January 11, 2007.
- Cohan RH, Bullard MA, Ellis JH, et al. Local reactions after injection of iodinated contrast material: detection, management, and outcome. Acad Radiol. 1997;4(11):711–718.
- Sistrom CL, Gay SB, Peffly L. Extravasation of iopamidol and iohexol during contrast-enhanced CT: report of 28 cases. Radiology. 1991;180:707–710. Available at: http://radiology.rsnajnls.org/cgi/content/abstract/180/3/707. Accessed January 11, 2007.
- Cochran ST, Bomyea K, Sayre JW. Trends in adverse events after IV administration of contrast media. AJR Am J Roentgenol. 2001;176:1385–1388. Available at: http://www.ajronline.org/cgi/content/abstract/176/6/1385. Accessed January 11, 2007.
- Jacobs JE, Birnbaum BA, Langlotz CP. Contrast media reactions and extravasation: relationship to intravenous injection rates. Radiology. 1998;209:411–416. Available at: http://radiology.rsnajnls.org/cgi/content/abstract/209/2/411. Accessed January 11, 2007.
- Federle MP, Chang PJ, Confer S, Ozgun B. Frequency and effects of extravasation of ionic and nonionic CT contrast media during rapid bolus injection. Radiology. 1998;206:637–640. Available at: http://radiology.rsnajnls.org/cgi/content/abstract/206/3/637. Accessed January 11, 2007.
- American College of Radiology. Manual on contrast media, version 5.0, 2004. Available at: http://www.acr.org/s_acr/sec.asp?CID=2131&DID=16687. Accessed January 11, 2007.
- IMV Medical Information Division Inc. 2004 CT census market summary report.
- US Department of Health and Human Services, National Practitioner Data Bank. March 2006. Available at: http://www.npdb-hipdb.com/. Accessed January 11, 2007.
- Medical Professional Liability (MPL) Reporting Claims Database. Florida Office of Insurance Regulation; 2006.
- D v W. NJ Court Queens County. #7307/96 (2000). Medical Litigation Alert. LexisNexis.
- Denis v Wilkens. NY Court Queens County. #7307/96 (1999). New York Jury Verdict Review & Analysis. LexisNexis.
- Disberry v Barnes. Florida Court Manatee County. CA 90-421, FJVR Ref No. 91:2-26 (1991). Florida Jury Verdict Reporter. LexisNexis.
- Durgan v St. Elizabeth. Oregon Court Baker County. #97-243 (1999). Oregon Litigation and Arbitration Reports. LexisNexis.
- Hulsey v Kim. Missouri Court #562171 (1991). St. Louis Verdict Reporter. LexisNexis.
- Plaintiff v Defendant. US Court Eastern Civil Action #84-4535 (1985). Pennsylvania Jury Verdict Review & Analysis. LexisNexis.
- Plaintiff v Hospital. PA Court Jan term 81-4036 (1984). Pennsylvania Jury Verdict Review & Analysis. LexisNexis.
- Wright v Lalla. NJ Court Essex County. #L-000346-90 (1994). Medical Litigation Alert. LexisNexis.
- Jemison v Winter Park Memorial. Florida Court Orange County. (1987). National Jury Verdict Review & Analysis. LexisNexis.
- Bock v Huntington Memorial. LA Superior Court GC 021 928 (1999). California Jury Verdicts Weekly. WestLaw.
- McEvoy v NY. NY Court Syracuse County. #98717 (2002). New York Jury Verdict Reporter. WestLaw.
TJU Puts 64-Slice CT in ED
Patients with chest pain and trauma victims benefit from speeded throughput and a reduction in unnecessary hospitalizations
By Renee DiIulio
Place a CT scanner in the emergency department (ED), and physicians will use it. Research has shown that CT utilization increases when the equipment is available in the ED. In fact, a paper presented at RSNA 2006 reported that growth in the utilization rate of CT in the ED outpaced that of patient volume.1 The researchers found that from 2000 to 2005, adult ED patient volume increased by 13% while head CT increased by 51%, cervical spine CT by 463%, chest CT by 226%, abdominal CT by 72%, and miscellaneous CT by 132%.1
Although the team did not collect data on the resulting impact on patient volumes, another group did. Beland et al examined the volume of trauma CT and diagnostic yield in a busy level I trauma ED over 6 years.2 The researchers found that the volume of examinations rose by 6% and diagnostic yield by 3%. Their conclusion: “This study demonstrates a concomitant increase in the diagnostic yield for these examinations.”2
These presentations had not been made when Thomas Jefferson University Hospital (TJU), Philadelphia, installed a Brilliance 64-slice CT from Philips Medical Systems, Andover, Mass, in the ED in October 2006. But by December, the hospital had already seen immediate improvements. “We have improved patient care, convenience, and throughput,” says Vijay Rao, MD, FACR, professor of radiology and department chair at TJU. She attributes a much shorter turnaround to the associated reduction in patient transport, and a decrease in unnecessary hospitalizations to the faster and more accurate diagnosis.
A review of the literature by Matthew Budoff, MD, associate professor of medicine in the division of cardiology at the Los Angeles Biomedical Research Institute of Harbor–University of California, Los Angeles, Medical Center, Torrance, Calif, found that “multi-slice CT has the potential to more effectively triage patients who present to the ED with chest pain.”3 Rao notes that it was the desire to provide cardiac CT service to patients presenting with chest pain that led the department to select a 64-slice CT. “We wanted to perform CTA examinations on low- and intermediate-risk patients to prevent unnecessary admissions and reduce patient waiting time,” she says.
Patients whose coronary CTA results are completely negative are discharged. “They do not undergo serial enzymes, they don’t wait 6 hours, and they avoid unnecessary hospitalization,” Rao explains.
Although the major driving factor was cardiac, trauma patients have benefited from 64-slice CT as well. “It’s wonderful to have a fast scanner for level I trauma patients,” Rao says. “We can scan large fields very quickly.”
The workflow process remains similar. ED physicians supervise the contrast injection, but the radiology department continues to manage the scanner, throughput, protocol, and readings. “The ED physicians are using the service no differently than when the exams were performed in the main radiology department,” she says. Patients, however, are no longer transported from the ED on the first floor of one building to radiology on the third floor of a connected building.
“Because we were fairly removed from the ED, there was a lot of time wasted transporting patients. And it required additional resources, because those who are critically ill require supervision,” Rao says. The ED had always expressed interest in having a CT scanner in the department, but the decision was left to radiology.
Rao felt that the new CT would allow the department to expand its capacity, which was needed, and improve its service to the ED. Because the service is so new, Rao has not yet collected data that illustrates the benefits, nor has she gathered utilization data. “We hear that a CT in the ED causes utilization to skyrocket, but we have not seen a substantial increase yet,” Rao says.
To keep the number of examinations reasonable, the department is informally educating ED physicians on the radiation risks of CT, but Rao would like to see more formal training take place throughout the enterprise. “It’s our role to educate the ED physician about radiation risk so that CT is not overutilized,” she says, noting that the hospital is currently examining workflow processes within the institution for additional process improvement.
“We are one piece of the entire pathway that the patient has to go through, so it’s a team approach. We’re trying to fine-tune our processes to reduce length of stay in the ED,” Rao notes. By eliminating such steps as transportation, they have taken a big step in improving patient care and workflow.
Renee Diiulio is a contributing writer for Axis Imaging News. For more information, contact .
References
- Broder J, Warshauer D. Emergency radiology (imaging applications in trauma and emergency care II): increasing emergency department utilization of computed tomography: 2000-2005. Session presented at: Annual Meeting of the Radiological Society of North America; November 27, 2006; Chicago. Available at: rsna2006.rsna.org/rsna2006/V2006/conference/event_display.cfm?id=66601&em_id=4427881. Accessed on January 12, 2007.
- Bleland M, Mayo-Smith W, Egglin T, Murphy B, Golding D, Biffl W. Emergency radiology (imaging applications in trauma and emergency care II): CT utilization in a level I trauma center over 6 years: have indications and diagnostic yield changed? Session presented at: Annual Meeting of the Radiological Society of North America; November 27, 2006; Chicago. Available at: rsna2006.rsna.org/rsna2006/V2006/conference/event_display.cfm?id=66601&em_id=4435537. Accessed on January 12, 2007.
- Budoff M. Cardiac CT in the emergency room. Applied Radiology. 2006;35(suppl)(12):48–55.
Market for Temporary Technologists Continues to Thrive
A 2006 survey of temporary imaging technologist staffing trends conducted by Med Travelers Inc, Irving, Tex, has assessed the state of the market and finds it to be thriving and trending toward subspecialization. Based on telephone interviews conducted with health care professionals using the services of temporary imaging technologists as well as temporary imaging technologists themselves, the report is divided into three parts: a section on trends among users of these services; a section on how temporary technologists view their jobs and why they choose to work as travelers; and a review of the temporary diagnostic imaging technologist assignments that Med Travelers conducted in 2006, showing which modalities are in the highest demand and fill rates by modality.
Phil Miller is vice president of communications for Med Travelers’ parent company, The MHA Group, a health care staffing firm. “There is a trend emerging toward the more mobile clinical work force,” he notes. “It started with nurses as a result of a shortage of nurses. Temps fill the gaps caused by termination, retirement, someone relocating, vacation, or when a center can’t recruit enough full-time people.”
Among some of the results attained by the Med Travelers survey:
- 80% of users surveyed had used temporary technologists during the past 12 months;
- 22% were currently looking for temporary technologists to supplement existing staff;
- 31% found it less difficult to locate traveling technologists compared with 2005, 26% found it more difficult, and 43% found it the same;
- 46% used one to three temporary technologists during the average month;
- 53% of technologists surveyed intended to work as travelers for more than 3 years;
- 55% had been working as travelers for more than 3 years already;
- 82% were not currently looking for a permanent position; and
- 67% were willing to travel nationwide.
Part III of the survey looks at the relative demand for imaging technologists working in various modalities.
“One of the results of the survey is that we’ve seen a relative decline in the demand for plain film techs and an increased demand for modalities having to do with cardiovascular areas,” Miller says. “That’s where we’re seeing the demand picking up.”
Indeed, the survey shows that only 13% of its 2006 staffing assignments were for radiologic technologists. However, the demand for ultrasound/vascular doubled compared with 2003, and the demand for interventional rose from 1% in 2003 to 19% in 2006.
“In general, we still see a strong demand,” Miller concludes. “Relative to most other professions, the demand for techs is still very strong.”
—C. Vasko
More than Meets the Eye
Materials management professionals build the foundation
By Dana Hinesly
The miracles of modern medicine would not be possible without the innumerable machines, applications, and accessories filling the halls and treatment rooms of health care organizations across the country. Putting these products in place takes oversight and, in most organizations, falls under the purview of the materials management group.
To what extent these teams are involved varies by location. Some handle specific departments, and others oversee multisite systems. In either situation, imaging purchases make up a considerable amount of the work, primarily due to the dollars involved with these assets.
“We spend more time on a major investment than we do on a routine purchase [of products], because in many cases, we already have a standard established on those products,” explains Jan P. Lea, vice president of materials management at Methodist Health System, Dallas; she developed a New Technology Committee for her hospital system, which reviews purchase requests. “We attended a health care advisory board session where they discussed this type of approach, giving examples of hospitals that bought technology that didn’t make sense, and we realized it is exactly what we needed.”
As its moniker implies, this committee specifically addresses new items, engaging in an extensive review process to ensure that the system does what it promises, is a good fit for the clinicians, and will provide a return on investment.
In the past few years, Lea’s committee has been put through the paces as the hospital system added a third hospital campus. “It was great getting to build a new hospital, because it gave us a lot of leverage,” she says. “When you’re buying that much imaging equipment at one time, you definitely get everybody’s attention.” Using this to its advantage, Methodist extended negotiations to meet more than just the immediate demands of the hospital. “I was able to lock in the price for all imaging purchases scheduled for the next 2 years at our two existing campuses,” Lea shares.
Virtually every aspect of the contract was on the table, including service, how many days of training the vendor would provide, payment terms, and the required deposit.
“The standard contract asks for a down payment, typically of 20%,” Lea says. “Twenty percent of an MRI is a lot of money, so we negotiate to waive that, because in some cases, we are buying imaging equipment and cutting a purchase order 2 years before it will be delivered it—and that would be a lot of time for [the vendor] to have the use of our funds.”
Negotiations are one of the last steps in the acquisition process, which begins either with a request from a clinician or as a result of publicized advancements in available systems.
“I review all requests for imaging equipment before they are presented to senior management for approval,” says Clark Saylor, consultant for radiology and asset management at Universal Health Services Inc, King of Prussia, Pa. “Our model is to have the end users define a performance spec, which, in many cases, takes the form of a proposal from a vendor. Our responsibility at corporate is to determine that the spec is consistent with the stated strategic direction and the financial goals of the facility.”
However it is initiated, Lea believes that itis vital for her team to be part of the process from the start. “Some of my peers get pulled into the process too late,” she says. “They are then in the position of trying to negotiate when it’s already clear to the vendor reps that they have the deal. If that’s the case, then there isn’t much that can be done at that point; your hands are tied.”
To avoid such instances, the materials management team at Methodist stays in close communication with the radiology director on each campus, staying informed about what is working for the radiologists, where they would like to see improvements, and contacting vendors to address concerns when necessary.
Providing the best possible environment for the medical personnel is a top priority for Lea and others in her field, which means they often are involved in virtually all areas of planning.
“Probably the biggest piece of my job that people are not aware of is working directly with the architects. It’s really important that we are able to plan the layout to achieve the desired result,” Lea says, noting that these decisions often have to be made 2 years in advance of the groundbreaking ceremonies. “We are involved with all of the design development from the very beginning. We plan everything from the lockers all the way down to every chair. It is our responsibility to buy everything that goes into the facility, and the architects design based on what we provide.”
The Way of the World
It is likely no surprise that improvements in technology have made the biggest impact on how materials managers approach their duties.
“In the past, you checked for available power HVAC [heating, ventilation, and air conditioning] capacity and sometimes water and drain requirements,” Saylor says. “Today, you must consider network connections, bandwidth requirements, data storage, and interfaces to other systems.”
Obtaining this perspective requires that materials teams work closely with others in the organization, including biomedical engineering and the IT/IS staff, to achieve the best result for the hospital. It also necessitates that the teams be aware of advancements and innovations.
“The New Technology Committee has evolved into looking at technology of the future and being proactive to identify the top 10 trends that we should be investigating,” Lea says. “The rapid changes in technology demand that we focus on what’s coming next, to see what new technologies hold promise and to determine if it makes sense to bring them into one of our facilities.”
Dana Hinesly is a contributing writer for Axis Imaging News. For more information, contact .