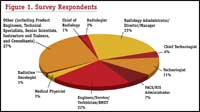
Throughout May 2006, visitors to our Web site responded to the magazine’s second-annual salary survey. Of 605 survey respondents (Figure 1), 23% were radiology administrator/director/managers; 22% were engineer/service/ technician/BMETs; 15% were technologists or chief technologists; 7% were PACS/RIS administrators; another 7% were working at the doctoral level as radiologists, radiation oncologists, medical physicists, and chiefs of radiology; and 27% reported other radiology titles, including product engineers, technical specialists, senior scientists, instructors and trainers, and consultants.
SALARY LEVELS
Figure 2 (Click image for larger view)
The overall average salary (Figure 2) for radiologic technologists was $57,920 per year, increasing to $67,198 for chief technologists. PACS/RIS administrators reported salaries averaging $69,262; engineer/service/technician/BMETs, $71,485; and radiology administrator/ director/managers, $84,471. Medical physicists reported average salaries of $139,664. Predictably, physicians reported the highest average levels of compensation: $241,667 for radiation oncologists, $294,800 for radiologists, and $343,333 for chiefs of radiology.
The physician respondents were all male; in other job titles, however, there were some gender-based disparities in pay (Figure 3). This was most evident for medical physicists, who were paid an average of $55,117 less per year if they were female. Males also were better paid in the roles of radiology administrator/director/ manager ($10,682 more than females) and chief technologist ($10,252 more). Pay for technologists and PACS/RIS administrators favored males only slightly (at $1,694 and $1,771, respectively), and female engineer/service/technician/BMETs were paid $203 more than males.
Figure 3 (Click image for larger view)
Age had a clear effect on compensation levels for three job titles, in particular: radiology administrator/director/manager, chief technologist, and PACS/RIS administrator (Figure 4). Compensation was unusually high in the 31?35 age range for these three titles, possibly reflecting a higher-than-average level of education attained by that age group. For technologists, however, the highest pay was reached in the 51?60 age group. For the engineer/technician/ service job title, employees older than 61 were paid most.
Although some of these age-related differences in pay might be expected to reflect experience, no general salary trends were apparent—by job title, for compensation relative to number of years spent with the respondent’s current employer, nor for total number of years spent in the field.
Technologists’ salaries did not vary greatly by subspecialty (Figure 5), ranging from $56,077 for interventional radiology to $67,171 for nuclear medicine, but compensation for technologists working in general radiology was an average of $52,258, perhaps indicating that employers award financial recognition for subspecialty experience and training. Chief technologists working in general radiology were, likewise, paid less (at $60,975) than those with subspecialty expertise, whose salaries ranged from $62,683 for CT to $75,000 for ultrasound. The same pattern held for the engineer/technician/service category, in which the average salary was lowest for general radiology, at $67,457, and highest for nuclear medicine, at $80,609.
Figure 4 (Click image for larger view)
Figure 5 (Click image for larger view)
Figure 6 (Click image for larger view)
Technologists, engineer/technician/service/ BMETs, and PACS/RIS administrators were paid most by hospitals and least by freestanding facilities, but the opposite was true for chief technologists, radiology administrator/director/managers, radiologists, and chiefs of radiology (Figure 6).
Figure 7a (Click image for larger view)
Figure 7b (Click image for larger view)
When salaries were analyzed by region (Figure 7), technologists were found to be receiving the best average salaries in the Mountain region (at $68,896) and the lowest salaries in the East South Central region (at $33,500). Chief technologists were paid least ($46,453) in the West North Central region and most ($79,507) in the Middle Atlantic region. Radiology administrator/director/ managers made least in the West North Central region (at $72,912) and most in US territories (at $100,000), followed by the Pacific region (at $96,988). PACS/RIS administrators were paid least ($58,697) in the East South Central region and most ($87,990) in the Middle Atlantic region. Medical physicists fared best in New England and worst in the East North Central region; for engineer/service/technician/ BMETs, the best pay was available in the East North Central region, and the worst was offered in the West North Central region.
FINANCIAL SATISFACTION
Figure 8 (Click image for larger view)
Only 14% of respondents indicated dissatisfaction with their compensation levels (Figure 8), with a response of 1 (5%) or 2 (9%) on a scale of 5. Satisfaction levels of 3 (26%), 4 (42%), or 5 (18%) were far more commonly reported. Most respondents indicated that they were being compensated fairly for their work, based on the level of education that they had attained (Figure 13). On a scale of 1 through 5, with 5 meaning “very satisfied,” only 20% indicated dissatisfaction, with a response of 1 (7%) or 2 (13%). A satisfaction level of 3 was chosen by 23%, and the majority (57%) were quite satisfied, choosing a response of 4 (32%) or 5 (25%). Respondents also felt that they were being compensated fairly based on their experience (Figure 12), with more than three fourths choosing satisfaction levels of 3 (26%), 4 (35%), or 5 (17%). A satisfaction level of 2 (15%) or 1 (7%) indicated dissatisfaction.
Salaries in radiology, like those in many other areas of health care, often are supplemented by other forms of compensation (Figure 17). In fact, only 28% of respondents reported that their employers paid nothing beyond their negotiated salaries. On-call pay was collected by 27% of those surveyed; overtime pay, by 34%; and bonuses, by 28%. Bonuses have become fairly common tools for employee recruitment and retention, but they also are paid for increasing personal or departmental efficiency in some facilities, and they can be offered as compensation for working less-popular night and weekend shifts.
Health insurance (91%), life insurance (82%), retirement plans (82%), and dental insurance (81%) were the benefits most commonly reported by respondents as being part of their compensation packages. Tuition reimbursement (60%) also was commonly available, but profit sharing (18%) and use of a company car (12%) were unusual. Other, unspecified benefits were named by 8% of those surveyed, and 2% reported that they received no benefits at all. (See Figure 16 for more information.)
Figure 9 (Click image for larger view)
JOB SATISFACTION
Perhaps because of ongoing staff shortages, 26% of respondents felt that they were required to cope with unacceptable workloads (Figure 9). First shift was the primary work schedule for 93.6% of those surveyed, with 3.3% working second shift, 0.3% working third shift, and 2.8% working rotating shifts. Only 3% of respondents worked four weekends per month, and 2% worked three weekends. Fewer than one third of respondents worked one (21%) or two (9%) weekends per month, and 65% had no weekend shifts.
Figure 10 (Click image for larger view)
An overwhelming majority of respondents were happy with radiology as a field (Figure 10)—91% stated that they would recommend their own professions to others.
Kris Kyes is technical editor for Medical Imaging.