MRA spectroscopy is a noninvasive means of obtaining metabolic information.1 MRI is a technique used for the noninvasive detection and anatomical mapping of water protons (hydrogen), whereas MR spectroscopy records protons in intrinsic phosphorus-containing metabolites, sodium, potassium, carbon, nitrogen, and fluorine.2
 Sharad Maheshwari, MD Sharad Maheshwari, MD |
The most useful nuclei for human spectroscopy are hydrogen, phosphorus, sodium, and, to a lesser extent, carbon. Proton (hydrogen) MR spectroscopy (HMRS) has a greater signal-to-noise ratio (SNR) and better spatial resolution than phosphorus spectroscopy and is more easily integrated with MRI in a single examination. HMRS has the potential to record biochemistry in vivo, which can help in tissue characterization. The greatest clinical application of MR spectroscopy has been in imaging tumors, infarcts, and epileptic foci in the central nervous system.
HISTORY AND TECHNIQUES
 Suresh K. Mukherji, MD Suresh K. Mukherji, MD |
Purcell et al3 and Bloch et al4 first elucidated the principles of nuclear magnetic resonance in 1946. The technique of spectroscopy is widely applied in chemistry for the analysis of compounds in solution, and is a powerful tool for determining the structure of biological macromolecules. Similarly, MR spectroscopy can be used to identify important molecules in living tissue. Protons often are used for MR spectroscopy because of their high natural abundance and high nuclear magnetic sensitivity.5 Despite the huge number of biomolecules in tissue, relatively few are identifiable in vivo because only freely mobile compounds that are present in substantial concentrations give enough signals to be detected. The concentrations of metabolites of interest are in the millimolar range; water protons are a thousand times as common.6 For this reason, water resonance has to be suppressed so that the other molecules can be detected. The diagnostically resolvable hydrogen MR spectra may be obtained using clinical instruments (1.5 T or greater) and routinely used surface coils.
A basic step in spectroscopy is localization of the region of interest in all three spatial dimensions, yielding the volume of interest. This can be performed using two methods: single-voxel spectroscopy (SVS) or chemical-shift imaging (CSI). In clinical practice, SVS is the easier and faster technique for obtaining metabolic information.7 The voxel (volume element) being sampled has a minimum size of 1 cm3, using today’s equipment. At least 128 signal averages are required to obtain interpretable spectra within a clinically acceptable time period.1
 Figure 1. Metabolic peaks in normal proton MR spectroscopy (NAA: N-acetyl aspartate). Figure 1. Metabolic peaks in normal proton MR spectroscopy (NAA: N-acetyl aspartate). |
A homogeneous magnetic field is an important prerequisite for obtaining resolvable spectra. Shimming the field in the region of interest to the resonance of water assures the homogeneity of the field. Water is the dominant peak in all hydrogen spectroscopy. When the analog-to-digital conversion is done, the intensity of all metabolites is scaled relative to that of water. The most common technique used to suppress the water peak is chemical-shiftselective suppression. In some instances, it may also be desirable to suppress the signal from lipids because lipid peaks are large and may obscure some metabolites of interest. Application of chemical-shiftselective pulses centered on the lipid peak results in their suppression.
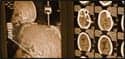
 Figure 2. (left) MRI in a child with Canavan disease shows megalencephaly with diffuse white-matter demyelination. (right) MR spectroscopy shows raised levels of N-acetyl aspartate, leading to noninvasive differentiation from Alexander disease. Figure 2. (left) MRI in a child with Canavan disease shows megalencephaly with diffuse white-matter demyelination. (right) MR spectroscopy shows raised levels of N-acetyl aspartate, leading to noninvasive differentiation from Alexander disease. |
Of the two commonly used localization techniques for SVS, only stimulated echo acquisition mode allows visualization of metabolites with short relaxation times. Water suppression is also more effective with this technique.8 Its disadvantages are a possible loss of signal intensity and high susceptibility to motion, quantum effects, and diffusion. The other commonly used technique, point-resolved spectroscopy,8 uses longer echo times and, therefore, allows visualization of metabolites with longer relaxation times. Many of the metabolites visualized using stimulated echo acquisition mode are not seen on point-resolved spectroscopy studies. Point-resolved spectroscopy studies are less susceptible to motion, quantum effects, and diffusion and have a better SNR than stimulated echo acquisition mode.
 Figure 3. (left) MRI of a left thalamic glioma (arrowhead). (right) MR spectroscopy of the lesion shows a raised choline peak with a depressed N-acetyl aspartate peak. Figure 3. (left) MRI of a left thalamic glioma (arrowhead). (right) MR spectroscopy of the lesion shows a raised choline peak with a depressed N-acetyl aspartate peak. |
Although most modern clinical MR spectroscopy units are capable of echo times as short as 20 milliseconds, adequate MR spectra may be obtained using echo times as long as 136 to 272 milliseconds. Using long echo times, the signal from most metabolites in the brain is lost. Conversely, short echo times allow for identification of many other metabolites. Postcontrast HMRS offers the possibility of localizing the voxel to the region, which is presumed to have pathological changes (zones of enhancement).
 Figure 4. MR spectroscopy from a case of glioblastoma showing a bifid lactate peak (Lac) at 1.3 ppm. The echo time used was 270 ppm. Figure 4. MR spectroscopy from a case of glioblastoma showing a bifid lactate peak (Lac) at 1.3 ppm. The echo time used was 270 ppm. |
CSI and spectroscopic imaging are used to sample multiple tissue volumes.9 The techniques used for multivolume localization are identical to those used to obtain single-volume localization, with the exception of additional phase-encoding gradients in two or three directions.10 Although CSI techniques offer the possibility of sampling larger tissue volumes subdivided into small voxels, they also require considerably longer acquisition and postprocessing times. With the use of echoplanar techniques, multivolume HMRS may be rapidly obtained, and this technique has been used for functional spectroscopy studies.11
METABOLITE SIGNIFICANCE
The results of spectroscopy are analyzed as a spectrum. The Fourier transformation interconverts the signals in the time domain to the frequency domain, which corresponds to the MR spectrum (Figure 1). Each peak of the spectrum is characterized by its resonance frequency, height, width, and area. Height or area under the peak may be calculated to give a relative measure of the concentrations of protons. The major brain metabolites detected are choline, creatine, N-acetyl aspartate (NAA), lactate, myoinositol, glutamine and glutamate, lipids, and the amino acids leucine and alanine.1
The most prominent resonance in a proton spectrum is NAA. The presence of NAA is attributable to its N-acetyl methyl group, which resonates at 2 ppm. This peak also contains contributions from less-important N-acetyl groups. NAA is accepted as a neuronal marker; as such, its concentration will decrease with many insults to the brain (such as neoplasms, infarcts, epilepsy, and dementia).12 Glutamate and N-acetyl-aspartyl-glutamate are colocated with NAA in neurons. Breakdown of N-acetyl-aspartyl-glutamate releases both NAA and glutamate, and subsequent breakdown of NAA leads to aspartate. These compounds are excitatory amino acids and are increased in the presence of ischemia. There is a marked increase in NAA peaks in Canavan diseases13-15 (Figure 2).
Creatine resonates at 3.03 ppm and contains contributions from creatine, creatine phosphate, and, to a lesser degree, gaminobutyric acid, lysine, and glutathione. An additional peak for creatine may be visible at 3.94 ppm. Therefore, the creatine peak is sometimes referred to as total creatine; it represents the energy source.16 The peak remains stable under many pathological conditions in the brain and is a useful reference to which the intensities of other peaks may be compared. Creatine is increased in hypometabolic states and decreased in hypermetabolic states. In normal spectra, creatine is located to the immediate right of choline (Figure 1) .
The peak for choline occurs at 3.2 ppm. Choline is a precursor of acetylcholine and a component of certain phospholipids. It contains contributions from glycerophosphocholine, phosphocholine, and phosphatidylcholine and reflects total brain choline stores.12 These compounds are involved in the synthesis and degradation of cell membranes, and their concentration may be affected in disorders that influence membrane turnover. Therefore, increased choline probably reflects increased membrane synthesis and/or an increased number of cells, as seen in tumors (Figure 3).
The lactate peak is a doublet of two distinct, resonant peaks at 1.32 ppm. Another peak for lactate occurs at 4.1 ppm. Because this is very close to that of water, it is generally suppressed. Altering the echo time confirms a peak at 1.32 ppm as lactate. At an echo time of 272 milliseconds, lactate projects above the baseline, but at an echo time of 136 milliseconds, the lactate doublet is inverted below the baseline (as shown in Figure 4, with an echo time of 270 milliseconds). This phenomenon is called j-coupling. The presence of lactate generally indicates that the normal cellular oxidative respiration mechanism is no longer in effect, and that carbohydrate catabolism is taking place.17
The myoinositol peak occurs at 3.56 ppm.18 Myoinositol is a metabolite involved in hormone-sensitive neuroreception and is a possible precursor of glucuronic acid.19 A triphosphorylated derivative of myoinositol is believed to act as a second messenger of intracellular calcium-mobilizing hormone.18 Myoinositol levels are raised in Alzheimer disease20 and hepatic encephalopathy.21,22 Decreased myoinositol content in the brain has been associated with the protective action of lithium in mania and the development of diabetic neuropathy.18 The peak is reduced in hyponatremia. The myoinositol peak is also significant in tissues outside the central nervous system (for example, in head and neck carcinoma).
Lipids have very short relaxation times and are normally not observed unless very short echo times are used. The protons of lipids produce peaks at 0.8, 1.2, 1.5, and 6.0 ppm. These peaks represent methyl, methylene, allelic, and the vinyl protons of unsaturated fatty acids.23 Fat contamination (voxel bleed) can contribute to the peaks. These metabolites may be increased in high-grade astrocytoma and lymphoma (Figure 5) and may reflect necrotic processes.26 Lipid peaks are normally much less intense or are absent at an echo time of 272 milliseconds because of their short relaxation times.
Glutamate and glutamine peaks are located between 2.1 and 2.5 ppm and may be represented by their sum. Glutamate is an excitatory neurotransmitter that plays a role in mitochondrial metabolism.19 A?-Amino butyric acid is an important product of glutamate. Glutamine plays a role in detoxification and regulation of neurotransmitter activity.24 Diagnostic elevation has been found in the great majority of patients with liver disease.
Amino acid peaks are valine (at 0.9 ppm), alanine (at 1.5 ppm), and leucine (at 3.6 ppm). They are seen as multiplets that invert at a 135-millisecond echo time. Valine and leucine are key markers of abscesses.25 Alanine is a nonessential amino acid of uncertain function. Its peak occurs between 1.3 and 1.4 ppm and, therefore, may be overshadowed by the presence of lactate. Alanine inverts when the echo time is changed from 270 to 236 milliseconds.
NEOPLASMS
 Figure 5. (left), MRI shows focal region of cortical dysplasia in right parietal cortical gray matter (arrowhead), biopsy proven. (right), MR spectroscopy of the same lesion shows a depressed choline peak without significant reduction in the N-acetyl aspartate peak, differentiating it from a low-grade tumor. Figure 5. (left), MRI shows focal region of cortical dysplasia in right parietal cortical gray matter (arrowhead), biopsy proven. (right), MR spectroscopy of the same lesion shows a depressed choline peak without significant reduction in the N-acetyl aspartate peak, differentiating it from a low-grade tumor. |
HMRS readily differentiates normal from abnormal brain tissues.26 In nearly 100% of primary brain tumors, MR spectroscopy is abnormal at presentation. The MR-spectroscopy characteristics of astrocytoma include a significant reduction in NAA, a moderate reduction in creatine, and an elevation of choline.27 Reduction of NAA reflects loss of neuronal elements as they are destroyed and/or replaced by malignant cells. Reduced creatine is probably related to an altered metabolism. Elevation of choline reflects increased membrane synthesis and cellularity. A few reports28,29 suggest that elevated choline, in the presence of lactate, correlates with a higher degree of malignancy. Raised lactate is commonly observed in glioblastoma multiforme.30 Elevation of lactate may reflect tumor hypoxia.
 Figure 6. (left), MRI of a glioblastoma in right parietal region (arrowhead). (right), MR spectroscopy of the lesion shows large lactate-lipid peaks, suggestive of a higher-grade tumor. Figure 6. (left), MRI of a glioblastoma in right parietal region (arrowhead). (right), MR spectroscopy of the lesion shows large lactate-lipid peaks, suggestive of a higher-grade tumor. |
MR spectroscopy may allow characterization of metabolic changes associated with tumor growth, degree of malignancy, grading of tumors, response to treatment, and the sequelae of treatment.31,32 Astrocytomata commonly have distinct imaging features by which low-grade growths can be differentiated from highly malignant types. NAA levels are low in all astrocytomata, but are lowest in grade-IV tumors. Conversely, choline is always elevated in solid astrocytomata, but is more so in those of higher grades. The presence of lactate generally reflects necrosis and, therefore, a higher degree of malignancy (Figure 6).
Choline is also elevated in some slowly growing tumors, such as meningiomata. The signal of choline is, however, markedly increased (up 300 times normal) in recurrent meningioma.33 Lactate and alanine may also be elevated, typically in fibrous-type meningioma.26 Atypical and malignant meningiomata, or those that invade the brain, may be difficult to differentiate from astrocytomata.
The spectroscopic appearance of lymphoma is similar to that of primary high-grade astrocytoma and metastases. MR spectroscopy shows a marked elevation of choline and lipids and a significant reduction in creatine and NAA.34 MR spectroscopy is helpful in assessing the response of lymphoma to treatment; successfully treated lymphoma shows progressive decreases in choline and lipids.
Cerebral parenchymal metastases have variable levels of choline, creatine, lactate, and lipids.35 NAA tends to be low or absent, reflecting the absence of neuroglial elements in metastases. Raised peaks of NAA can be observed and are attributed to partial volume averaging from adjacent brain tissues.30 The characteristic MR spectroscopy findings in metastases are the elevation of choline and lactate (reflecting active tumor growth and necrosis). Some metastases to the brain also contain lipids. Lipid resonance may also be present in high-grade astrocytomata and is caused by necrosis.
HMRS has been used to characterize extracranial head and neck malignancies in vivo.36-38 Mukherji et al39 have found that an increased choline/creatine ratio is present in all squamous-cell carcinoma of the upper aerodigestive tract. MR spectroscopy may also be useful in differentiating benign follicular thyroid masses from follicular malignancy.37 Thyroid carcinoma shows resonance from amino acids, glutamate (at 2.2 ppm), and valine (at 0.71 ppm). HMRS has been used to study orbital tumors.36,40 Despite their relatively small size, adequate MR spectra may be obtained in vivo. Ocular melanotic melanomata show a large peak at 6.72 ppm that corresponds to melanin.36
RADIATION, EPILEPSY, DEMYELINATION
Histologically, radiation injury is characterized by damage to the vascular endothelium that may result in ischemia and necrosis.41 MR spectroscopy shows elevated lactate in patients who have received radiation doses of 40 Gy or more to the brain.42 The lactate peaks can be identified before routine MRI shows the changes. MR spectroscopy helps in differentiating radiation necrosis from recurrent/residual tumor by demonstrating severely depressed levels of NAA, choline, and creatine in radiation necrosis. In addition, radiation necrosis shows a broad peak between 0 and 2 ppm corresponding to cellular breakdown products and probably consisting of free fatty acids, lactate, and amino acids.1 Elevated lactate, reflecting severe tissue ischemia, is also present. Tumor recurrence shows elevated choline/NAA, elevated choline/creatine, and the presence of lactate. Within the same mass, there may be areas of radiation necrosis in combination with areas of viable tumor, reducing the specificity of MR spectroscopy.
MRI can identify hippocampal abnormalities in many patients with refractory temporal-lobe epilepsy. In some cases, lateralization with electroencephalography and MRI is not accomplished easily. Visual determination of hippocampal abnormalities can be difficult, particularly in patients with bilateral involvement. MR spectroscopy can be used to localize seizure foci in temporal-lobe epilepsy as an alternative to positron-emission tomography and single-photonemission computed tomography.43 NAA is reduced in seizure foci (Figure 6).44,45 This decrease represents neuronal loss or damage in the region sampled. The epileptogenic hippocampus shows decreased NAA/choline ratios, and an increased or normal choline/creatine ratio. The ratio of NAA to choline plus creatine is the most reproducible parameter for hippocampal MR spectroscopy on a 1.5-T scanner.46 There may be raised levels of lactate in the temporal lobes after an episode of acute temporal-lobe epilepsy.47
Patients with multiple sclerosis exhibit plaques in various stages of the demyelinating process. Although MRI has excellent sensitivity in detecting the lesions, it lacks the specificity needed to characterize the precise stage of the demyelinating process. MR spectroscopy is a sensitive tool for studying the biochemical behavior of demyelinating plaques in vivo and understanding their natural history and pathophysiology. MR spectroscopy helps to distinguish early lesions from late, irreversible lesions.48 In the acute stage of the plaque, the choline/creatine ratio is increased while NAA is normal, indicating that the axons have not been permanently damaged. In subacute-to-chronic plaque, there is a decrease in the NAA/creatine ratio, suggesting permanently damaged neurons. Resonance corresponding to free lipids (0.9 to 1.6 ppm) has been observed in chronic multiple sclerosis plaques and may reflect disintegration of myelin.49
INFECTION
 Figure 7. (left) MRI shows left medial temporal sclerosis (*). (center) MR spectroscopy from the contralateral, normal side. (right) MR spectroscopy from the lesion side shows markedly depressed peaks of N-acetyl aspartate. Figure 7. (left) MRI shows left medial temporal sclerosis (*). (center) MR spectroscopy from the contralateral, normal side. (right) MR spectroscopy from the lesion side shows markedly depressed peaks of N-acetyl aspartate. |
MR spectroscopy is a potential tool for differential diagnosis between brain abscesses and noninfectious lesions such as primary brain tumor, lymphoma, brain metastasis, and tuberculoma. There are specific changes in MR spectra due to abscesses; these include the occurrence of resonance representing acetate, lactate, pyruvate, and succinate. These, except lactate, are known metabolic end products arising from microorganisms. Also seen are amino-acid signals at 0.9 ppm and assigned to valine, leucine, and isoleucine.20 These are considered to represent either the accumulated end products of proteolysis caused by the enzymes secreted by microorganisms or the polymorphonuclear leukocytes in pus, or both. In order to observe these metabolites, HMRS using short echo times is needed. There is reportedly a reversal of the lactate peak in an abscess after treatment,50 so MR spectroscopy might be useful for evaluating posttreatment changes.
Conventional MRI is not sensitive to the earliest stages of HIV infection of the brain. HMRS demonstrates marked metabolic alteration in patients with only mild AIDS-related dementia. Virus-infected macrophages, through some indirect mechanism, damage the neurons, resulting in reduced NAA.51 There are corresponding decreases in NAA/choline and NAA/creatine ratios, and there is an increased choline/creatine ratio in the subcortical gray-matter structures. Longitudinal studies have demonstrated that HMRS is useful in monitoring disease progression and treatment effects. MR spectroscopy also has a prognostic implication. After therapy, there is evidence of improvement in the NAA/creatine ratio, suggesting that NAA/creatine changes are reversible; this could help in treatment trials. HIV-positive newborns have normal brain MRI scans but show abnormal proton MR spectra as early as 10 days after birth.52 Abnormal resonance between 2.1 and 2.6 ppm (overlapping the NAA peak) may be present. The significance of these marker peaks is unknown.
OTHER DISORDERS
Cortical dysplasia can be confused with low-grade gliomata in routine MRI scans. MR spectroscopy can differentiate between the two by showing raised choline peaks in tumors. Cortical dysplasia may show some reduction in NAA levels, but it is not as marked as in tumors53(Figure 5). Lee et al54reported metabolic peaks similar to those of normal gray matter in a case of cortical dysplasia.
The clinical symptoms and imaging features of leukodystrophy can be nonspecific, although many such disorders have specific biochemical markers. MR spectroscopy holds promise as a noninvasive tool for early diagnosis and follow-up imaging. Spectroscopy is extremely helpful in differentiating Canavan disease from Alexander disease; clinical features (megalencephaly and diffuse demyelination) overlap. Canavan disease, however, has raised NAA levels because of deficient levels of the enzyme N-acetyl aspartase (Figure 2).13-15? Patients with childhood adrenoleukodystrophy show decreased NAA/creatine ratios and increased choline/creatine ratios (Figure 4).55These patients also show elevated lactate, glutamate, glutamine, and inositol peaks.
MELAS is the term used for the syndrome clinically characterized by mitochondrial myopathy, encephalopathy, lactic acidosis, and cerebrovascular accident.56 MRI findings include abnormal signal intensity in the basal ganglia and infarctions. In patients with this disorder, HMRS shows an elevation of lactate.56,57 Brain edema may occur in infants with galactosemia and has been associated with accumulation of galactitol. MR spectroscopy demonstrates elevated brain galactitol levels in newborn infants with galactosemia who exhibit massive urinary galactitol excretion. MR spectroscopy is used to monitor the levels of galactitol during therapy.58
MRI in patients with neurofibromatosis type 1 will show areas of increased signal intensity in the brain.59 These lesions (hamartomata) are not malignant, but 6% to 15% of patients having them will develop cerebral astrocytomata. These are commonly of low histological grade and may be indistinguishable from hamartomata using MRI alone. Because astrocytomata have significantly different proton MR spectra than normal brain tissue, they may be readily distinguished from hamartomata.60
Sharad Maheshwari, MD, is a visiting scholar in the Department of Radiology at the University of Michigan, Ann Arbor, and Suresh K. Mukherji, MD, is chief of neuroradiology and neuroradiology fellowship program director in the Department of Radiology, University of Michigan Health System, Ann Arbor.
References:
- Castillo M, Kwock L, Mukherji SK. Clinical applications of proton MR spectroscopy. AJNR Am J Neuroradiol. 1996;17:1??”15.
- Ross B, Blum LS. Magnetic resonance spectroscopy of the human brain. Anat Rec. 2001;265:54-84.
- Purcell EM, Torrey HC, Pound RV. Resonance absorption by nuclear magnetic moments in solids. Physiol Rev. 1946; 69:37??”38.
- Bloch R, Hansen WW, Packard M. Nuclear induction. Physiol Rev. 1946;69:127.
- Lenkinski RE, Schnall MD. MR spectroscopy and the biochemical basis of neurological disease. In: Atlas SW, ed. Magnetic Resonance Imaging of the Brain and Spine. New York: Raven; 1991:1099??”1121.
- Kwock L. Clinical proton magnetic resonance spectroscopy: basic principles. In: Mukherji SK, ed. Clinical Applications of MR Spectroscopy. New York: Wiley-Liss; 1998:1-32
- Castillo M, Kwock L, Scatliff J, Mukherji SK. Proton MR spectroscopy in neoplastic and non-neoplastic brain disorders. Magn Reson Imaging Clin N Am. 1998;6:1-208
- Kwock L. Localized MR spectroscopy: basic principles. Neuroimaging Clin N Am. 1998;8:713-732.
- Furuya S, Naruse S, Ide M, Murakami K, Miyazaki T, Yamamoto T. The clinical application of multi-voxel 1H-CSI (chemical shift imaging) in brain tumors. Nippon Igaku Hoshasen Gakkai Zasshi. 1991;51:836-838.
- Duijn JH, Matson GB, Maudsley AA, Weiner MW. 3D phase encoding 1H spectroscopic imaging of human brain. Magn Reson Imaging. 1992;10:315??”319.
- Richards TL, Dager SR, Posse S. Functional MR spectroscopy of the brain. Neuroimaging Clin N Am. 1998;8:823-834.
- Miller BL. A review of chemical issues in 1H NMR spectroscopy: N-acetyl-L-aspartate, creatine, and choline. NMR Biomed. 1991;4:47??”52.
- Austin SJ, Connelly A, Gadian DG, Benton JS, Brett EM. Localized 1H NMR spectroscopy in Canavan’s disease: a report of two cases. Magn Reson Med. 1991;19:439??”445.
- Grodd W, Krageloh-Mann I, Petersen D, Trefz FK, Harzer K. In vivo assessment of N-acetylaspartate in brain in spongy degeneration (Canavan’s disease) by proton spectroscopy. Lancet. 1990;336:437??”438.
- Marks HG, Caro PA, Wang Z, et al. Use of computed tomography, magnetic resonance imaging, and localized 1H magnetic resonance spectroscopy in Canavan’s disease: a case report. Ann Neurol. 1991;30:106??”110.
- Kreis R, Ernst T, Ross BD. Development of the human brain: in vivo quantification of metabolite and water content with proton magnetic resonance spectroscopy. Magn Reson Med. 1993;30:424??”437.
- Sanders JA. Magnetic resonance spectroscopy. In: Orrison WW, Lewine JD, Sanders JA, Harthshorne MF, eds. Functional Brain Imaging. St Louis: Mosby; 1995:419??”467.
- Ceodan S, Parrilla R, Santoro J, Rico M. H-1 NMR detection of cerebral/myo-inositol. FEBS Lett. 1985;187:167??”172.
- Van der Knaap MS, Ross B, Valk J. Uses of MR in inborn errors of metabolism. In: Kucharczyk J, Mosely M, Barkovich AJ, eds. Magnetic Resonance Neuroimaging. Boca Raton, Fla: CRC Press; 1994:245??”318.
- Shonk TK, Moats RA, Gifford P, et al. Proton magnetic resonance spectroscopy: a diagnostic tool for probable Alzheimer disease. Radiology. 1995;195:65??”72.
- Kreis R, Ross BD, Farrow NA, Ackerman Z. Metabolic disorders of the brain in chronic hepatic encephalopathy detected with H-1 MR spectroscopy. Radiology. 1992;182:19??”27.
- Kreis R, Farrow N, Ross BD. Localized 1H NMR spectroscopy in-patients with chronic hepatic encephalopathy: analysis of changes in cerebral glutamine, choline and inositols. NMR Biomed. 1991;4:109??”116.
- Castillo M, Kwock L, Scatliff JH, Gudeman S, Greenwood R. Proton MR spectroscopic characteristics of a presumed giant sub-cortical heterotopia. AJNR Am J Neuroradiol. 1993;14:426??”429.
- Michaelis T, Merboldt KD, Bruhn H, Hanike W, Frahm J. Absolute concentrations of metabolites in the adult human brain in vivo: quantification of localized proton MR spectra. Radiology. 1993;187:219??”227.
- Grand S, Passaro G, Ziegler A, et al. Necrotic tumor versus brain abscess: importance of amino acids detected at 1H MR spectroscopy??”initial results. Radiology. 1999;213:785-793.
- Bruhn H, Frahm J, Gyngell ML, et al. Noninvasive differentiation of tumors with use of localized H-1 MR spectroscopy in vivo: initial experience in patients with cerebral tumors. Radiology. 1989;172:541??”548.
- Burtscher IM, Holtas S. Proton magnetic resonance spectroscopy in brain tumours: clinical applications. Neuroradiology. 2001;43:345-352.
- Demaerel P, Johannik K, van Hecke P, et al. Localized 1 H NMR spectroscopy in fifty cases of newly diagnosed intracranial tumors. J Comput Assist Tomogr. 1991;15:67??”76.
- Herholz K, Heindel W, Luyten PR, et al. In vivo imaging of glucose consumption and lactate concentration in human gliomas. Ann Neurol. 1992;31:319-27.
- Tien RD, Lai PH, Smith JS, Lazeyras F. Single voxel proton brain spectroscopy exam (PROBE/SV) in patients with primary brain tumors. AJR Am J Roentgenol. 1996;167:201-209.
- Fulham MJ, Bizzi A, Dietz MJ, et al. Mapping of brain tumor metabolites with proton MR spectroscopic imaging: clinical relevance. Radiology. 1992;185:675??”686.
- Castillo M, Smith JK, Kwock L. Correlation of myo-inositol levels and grading of cerebral astrocytomas. AJNR Am J Neuroradiol. 2000;21:1645-1649.
- Kugel H, Heindel W, Ernestus RI, Bunke J, du Mesnil R, Fried-Mann G. Human brain tumors: spectral patterns detected with localized H-1 MR spectroscopy. Radiology. 1992;183:701??”709.
- Bizzi A, Movsas B, Tedeschi G, et al. Response of non-Hodgkin lymphoma to radiation therapy: early and long-term assessment with H-1 spectroscopic imaging. Radiology. 1995;194:271-276.
- Castillo M, Kwock L. Proton MR spectroscopy of common brain tumors. Neuroimaging Clin N Am. 1998;8:733-752.
- Mafee MF, Barany M, Gotsis ED, et al. Potential use of in vivo proton spectroscopy for head and neck lesions. Radiol Clin N Am. 1989;27:243??”254.
- Russel P, Lean CL, Delbridge L, May GL, Dowd S, Mountford CE. Proton magnetic resonance and human thyroid neoplasia. I: discrimination between benign and malignant neoplasms. Am J Med. 1994;96:383??”388.
- McKenna WG, Lenkinski RE, Hendrix RA, Vogele K, Bloch P. The use of magnetic resonance imaging and spectroscopy in the assessment of patients with head and neck and other superficial malignancies. Cancer. 1989;64:2069??”2075.
- Mukherji SK, Schiro S, Castillo M, Kwock L, Muller KE, Blackstock W. Proton MR spectroscopy of squamous cell carcinoma of the extracranial head and neck: in vitro and in vivo studies. AJNR Am J Neuroradiol. 1997;18:1057??”1072.
- Gomori JM, Grossman RI, Shields JA, Augsburger JJ, Joseph PM, DeSimeone D. Ocular MR imaging and spectroscopy: an ex vivo study. Radiology. 1986;160:201??”205.
- Chan YL, Yeung DK, Leung SF, Cao G. Proton magnetic resonance spectroscopy of late delayed radiation-induced injury of the brain. J Magn Reson Imaging. 1999;10:130-137.
- Gober JR. Noninvasive tissue characterization of brain tumor and radiation therapy using magnetic resonance spectroscopy. Neuroimaging Clin N Am. 1993;3:779-802.
- Achten E, Santens P, Boon P, et al. Single-voxel proton MR spectroscopy and positron emission tomography for lateralization of refractory temporal lobe epilepsy. AJNR Am J Neuroradiol. 1998;19:1??”8.
- Gadian DG, Connelly A, Duncan JS, et al. 1 H magnetic resonance spectroscopy in the investigation of intractable epilepsy. Acta Neurol Scand. 1994;152:116??”121.
- Breiter SN, Arroyo S, Mathews VP, Lesser RP, Bryan RN, Barker PB. Proton MR spectroscopy in patients with seizure disorders. AJNR Am J Neuroradiol. 1994;15:373??”384.
- Hsu YY, Chen MC, Lim KE, Chang C.. Reproducibility of hippocampal single-voxel proton MR spectroscopy and chemical shift imaging. AJR Am J Roentgenol. 2001;176:529??”536.
- Castillo M, Smith JK, Kwock L. Proton MR spectroscopy in patients with acute temporal lobe seizures. AJNR Am J Neuroradiol. 2001;22:152??”157.
- Kimura H, Grossman RI, Lenkinski RE, Gonzalez-Scarano F. Proton MR spectroscopy and magnetization transfer ratio in multiple sclerosis: correlative findings of active versus irreversible plaque disease. AJNR Am J Neuroradiol. 1996;17:1539??”1547.
- Koopmans RA, Li DK, Zhu G, Allen PS, Penn A, Paty DW. Magnetic resonance spectroscopy of multiple sclerosis: in-vivo detection of myelin breakdown products. Lancet. 1993;341:631??”632.
- Burtscher IM, Holta S. In vivo proton MR spectroscopy of untreated and treated brain abscesses. AJNR Am J Neuroradiol. 1999;20:1049??”1053.
- Meyerhoff DJ, MacKay S, Poole N, Dillon WP, Weiner MW, Fein G. N-acetylaspartate reductions measured by 1 H MRSI in cognitively impaired HIV-seropositive individuals. Magn Reson Imaging. 1994;12:653??”659.
- Cortey A, Jarvik JG, Lenkinski RE, Grossman RI, Frank I, Delivoria-Papadopoulos M. Proton MR spectroscopy of brain abnormalities in neonates born to HIV-positive mothers. AJNR Am J Neuroradiol. 1994;15:1853??”1859.
- Aasly J, Silfvenius H, Aas TC, et al. Proton magnetic resonance spectroscopy of brain biopsies from patients with intractable epilepsy. Epilepsy Res. 1999;35:211-217.
- Lee BC, Schmidt RE, Hatfield GA, Bourgeois B, Park TS. MRI of focal cortical dysplasia. Neuroradiology. 1998;40:675-683.
- Tzika AA, Ball WS, Vigneron DB, Dunn RS, Nelson SJ, Kirks DR. Childhood adrenoleukodystrophy: assessment with proton MR spectroscopy. Radiology. 1993;189:467??”480.
- Castillo M, Kwock L, Green C. MELAS syndrome: imaging and proton MR spectroscopic findings. AJNR Am J Neuroradiol. 1995;16:233??”239.
- Barkovich AJ, Good WV, Koch TK, Berg BO. Mitochondrial disorders: analysis of their clinical and imaging characteristics. AJNR Am J Neuroradiol. 1993;14:1119??”1137.
- Wang ZI, Berry GT, Dreha SF, Zhao H, Segal S, Zimmerman RA. Proton magnetic resonance spectroscopy of brain metabolites in galactosemia. Ann Neurol. 2001;50:266-269.
- Sevick RJ, Barkovich AJ, Edwards MSB, et al. Evolution of white matter lesions in neurofibromatosis type 1: MR findings. AJR Am J Roentgenol. 1992;159:171??”175.
- Castillo M, Green C, Kwock L, et al. Proton MR spectroscopy inpatients with neurofibromatosis type 1: evaluation of hamartomas and clinical correlation. AJNR Am J Neuroradiol. 1995;16:141??”147.